Stock market
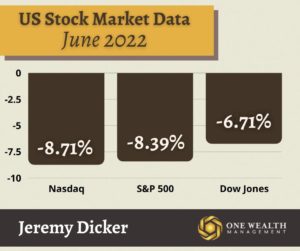
For the month of June, the major U.S. stock indices performed as follows:
Dow Jones -6.71%
S&P500 -8.39%
Nasdaq -8.71%
Despite a positive trading day on July 1st, all three indices posted their fourth negative week out of five.
In fact, the first six months of 2022 have seen a historical amount of red for Wall Street, with the worst losses through the first half of 2022 since the first six months of 1970.
At the halfway mark of 2022, the S&P 500 was down about 20.58%, the Nasdaq 100 down 29.51%, and the Dow was down 15.3% – its worst first half since 1962.
June 30th also closed out Q2, with the Dow and S&P 500 posting their worst quarter since Q1 2020. In Q2 2022, the Nasdaq Composite posted its worst quarter since 2008.
Since the end of 2021, the U.S. stock market has seen about $9 trillion dematerialize, according to Bloomberg’s analysis of the S&P 1500 index.
Biggest Losers: Tech, Bed, Bath, and Beyond, and “Bitcoin Bros”
Tech stalwarts Apple, Microsoft, and Alphabet lost nearly a quarter of their value through the first half of 2022, while Amazon shed 37% and Meta more than half of its value.
In just a single day, shares of Bed Bath & Beyond (BBBY) declined more than 23% as the retailer was hit not only by a paltry sales report (down 20% in the previous quarter) but the announcement that CEP Mark Tritton would be exiting the company,
And the saga of crypto selloffs continues, with Bitcoin falling by more than 55% since April 1st, barely clinging to the $19,000 mark to end the first half of 2022.
Fed watch
In an effort to combat inflation, the Federal Open Market Committee (FOMC) dropped its benchmark interest rate by three-quarters of a percent (75 basis points) in mid-June, making it the largest Fed increase since 1994.
The Fed has raised rates three times so far in 2022, and many analysts expect four more rate hikes through the end of this year. The central bank’s next meeting is scheduled for July 26 and 27, and Fed policymakers have signaled another 75bps rate hike.
However, a smaller 50bps rate hike is still on the table at the Fed’s July meeting, with the employment report (July 8th) and Consumer Price Index recording (July 13th) expected to impact their decision.
Consumer Spending
Real personal spending dropped by 0.4% in May (latest data), a larger-than-expected fall after showing strong gains (0.7%) in April. Analysts interpret May’s fall in spending as a sign that consumers are tightening their wallets and purse strings as inflation takes its toll.
While personal income increased 0.5% in May, according to the Bureau of Economic Analysis, totaling $113.4 billion, data reveals that since the start of the year, rising prices due to inflation have absorbed the vast majority of employee wage gains.
Inflation
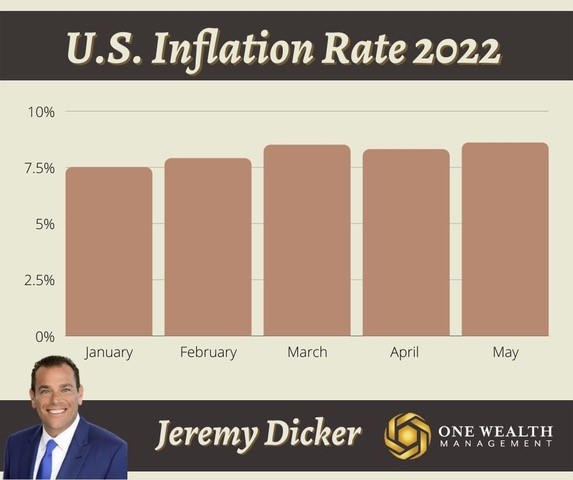
The most current inflation numbers (published by the U.S. Labor Department on June 10th) reveal that in the 12 months ending May 2022, the annual U.S. inflation rate was 8.6%. That was the largest annual increase since December 1981 and jumped well past an estimated 8.3% increase.
2022 Y-o-Y Inflation by month:
Jan 7.5
Feb 7.9
Mar 8.5
April 8.3
May 8.6
June – available July 13th
The core personal consumption expenditures index, the Fed’s favorite measure of inflation, rose 4.7% for the latest month. While that is 0.2 percentage points less than the previous month and slightly less than the 4.8% expected rate, it still leaves us at nearly a four-decade high.
Turning to the Consumer Price Index, another popular gauge of inflation, we see a 292.296 mark for May, up from 289.109 in April. (June’s inflation data will be available July 13th.)
2022 Consumer Price Index by Month
Jan 281.148
Feb 283.716
March 287.504
April 289.109
May 292.296
June – available July 13th
The sectors that saw the largest year-over-year price increases in May 2022 include:
Energy prices +34.6%
Food costs +10.1%
Shelter +5.5%
Used cars and trucks +16.1%
Airline fares +37.8%
The cost of new vehicles was one of the only items to fall in annualized price (12.6% down from 13.2%).
Jobs & Employment
The next jobs report is scheduled to be released on July 8th, extrapolating June’s employment data.
Economists expect to see an increase of around 250,000 jobs for June, a noticeable drop from the 390,000 jobs that we know were added throughout May. That would still reveal strong job growth and a solid labor market despite employment numbers falling.
Those anticipated job numbers would also keep the unemployment rate steady at around 3.6%.
We do know that everyone from the Fed to Wall Street will be watching July 8th’s job report numbers carefully, either confirming or soothing fears of an imminent recession.
Recession Watch
Currently, respected recession forecaster GDPNow predicts a 2.08% drop in GDP for Q2 2022. That would technically put us in recession territory (two straight quarters of negative GDP growth) according to one widely accepted definition. (Our GDP fell 1.6% in the first quarter of 2022.)
That data will come on July 28th.
However, the official ruling on recessions comes from The National Bureau of Economic Research (NBER). According to the NBER, a recession is defined as “a significant decline in economic activity that is spread across the economy and that lasts more than a few months.”
Whether we can say we’re in a recession right now or not, a recent Bankrate survey of 17 top economists found that the odds for a recession sometime during the next 18 months were 50-50.
Housing market
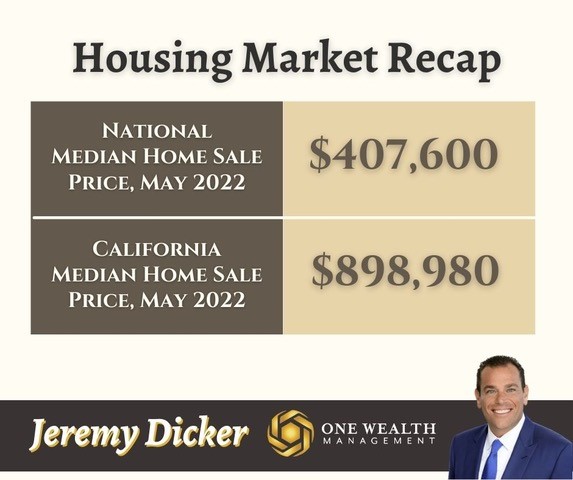
The national median home sale price for existing homes surpassed $400,000 for the first time ever in May of 2022, climbing to $407,600 – a 14.8% increase since May of 2021.
While we haven’t seen median prices drop, we have seen sales volume slow significantly. In fact, month-over-month sales volume declined in three out of four regions across the U.S., and year-over-year sales numbers dropped in all four regions.
Of course, a large part of this slowdown in sales volume is due to rapidly rising interest rates, which not only cooled buyer demand but widened the affordability gap.
Here in California, the data mirrored national trends. The median home sale price reached an all-time high of $898,980 in May, up 1.6% over the previous month and 9.9% year-over-year. However, the pace of sales is slowing, falling both month-over-month and year-over-year.
Mortgage rates
We saw a welcome respite from rising mortgage rates last week, as the national average for a 30-year fixed reversed course down to 5.7%, and the average 15-year fixed fell to 4.83%, according to Freddie Mac.
This recent decline in mortgage rates offers much-needed stabilization for a housing market that is still trying to find its balance after a shift away from one of the hottest sellers’ markets in history.
Notable quote:
“Is there a risk we would go too far? Certainly there’s a risk. The bigger mistake to make — let’s put it that way — would be to fail to restore price stability.”
-Fed Chairman Jerome Powell

 https://www.mvtinvest.com/campaigns/monthly-market-insights